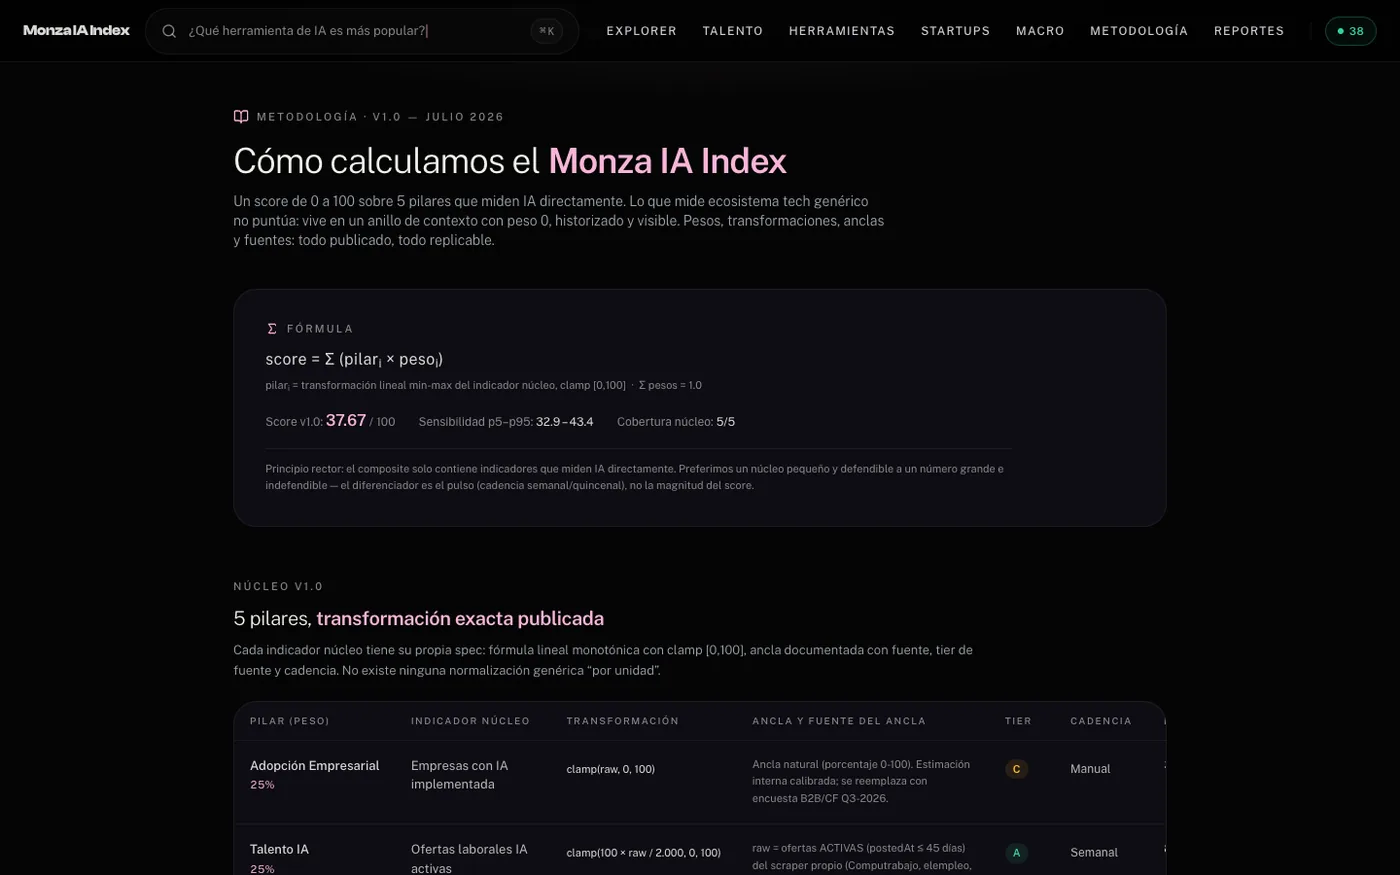
A 0 to 100 score across five pillars, with published weights, anchors and sources.
Monza Index
An index that measures how much artificial intelligence is really used in Colombia, with data anyone can check.
Our own productMarket intelligenceColombia
Six things, one index.
A system that reads job boards, searches and open data, and sorts them by pillar.
The index website, with an explorer for talent, tools, startups and context.
An artificial intelligence interviewer that runs the company survey.
A private space for each partner, with an assistant that answers questions about its data.
Quarterly reports to decide with data.
We built it from start to finish.
- DesignsThe product: the index, the methodology and how it looks on screen.
- BuildsThe website, the explorer and the partner spaces.
- CalculatesThe reading of the sources and the score of each pillar.
- TalksWith each company, through an AI interviewer, and with each partner, through its assistant.
Everyone talks about artificial intelligence. Almost no one measures it.
A number was missing.
The conversation about AI was full of opinions and one-off surveys; what was missing was an indicator you could follow over time.
The data was scattered.
Job offers, searches, company registries and economic figures lived in different sources, and no one was cross-checking them.
It had to be auditable.
An index that companies and industry groups will quote needs its formula in plain sight, not a black box.
Six pieces, one index.
From public data to the score, and from the score to the conversation with each company. Tap any piece to see what it does and what it solves.
In pink, the piece you are looking at and how it connects.
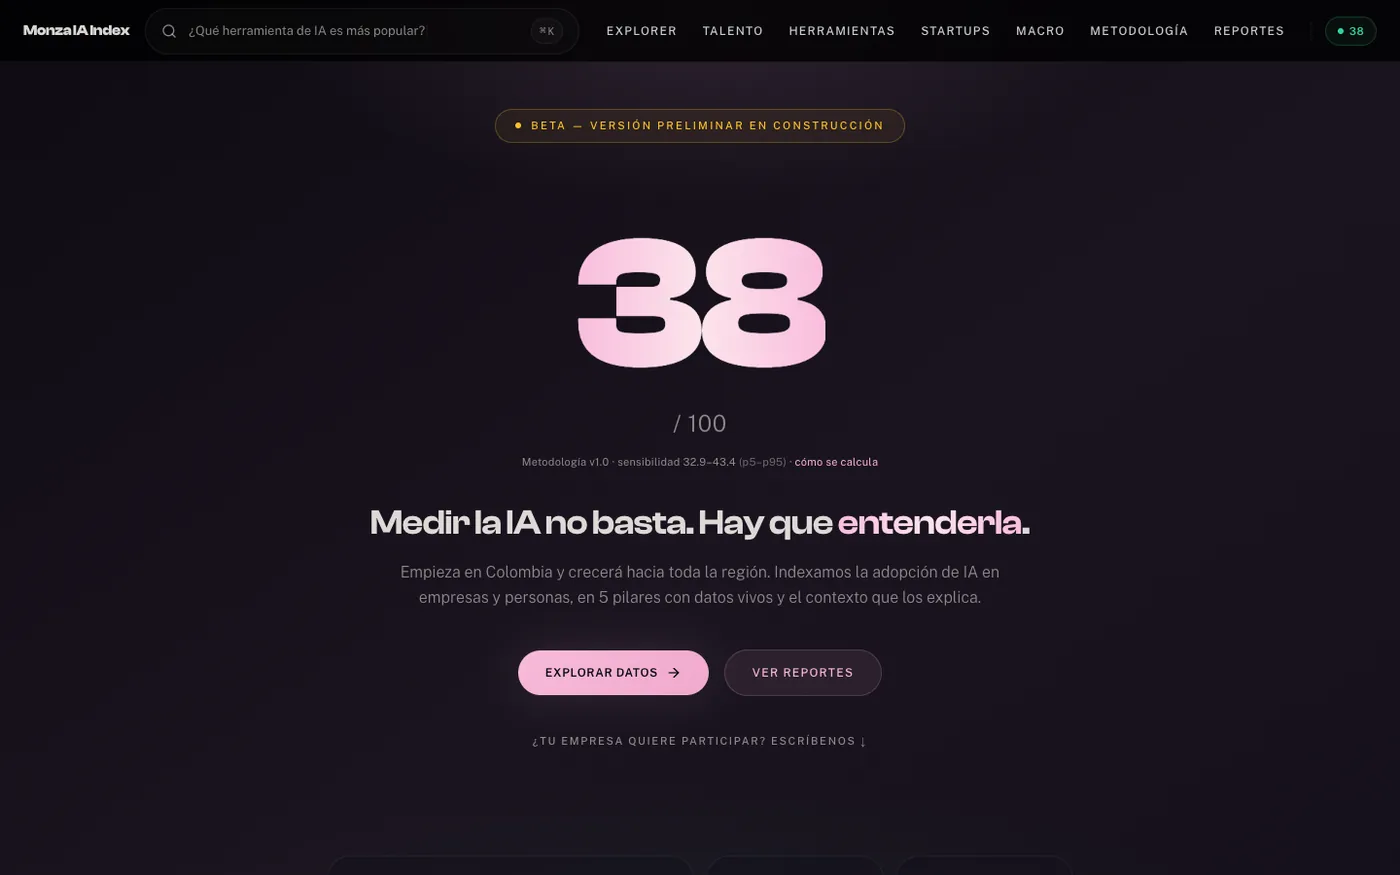
01 · The index
A number from 0 to 100, with the formula in plain sight.
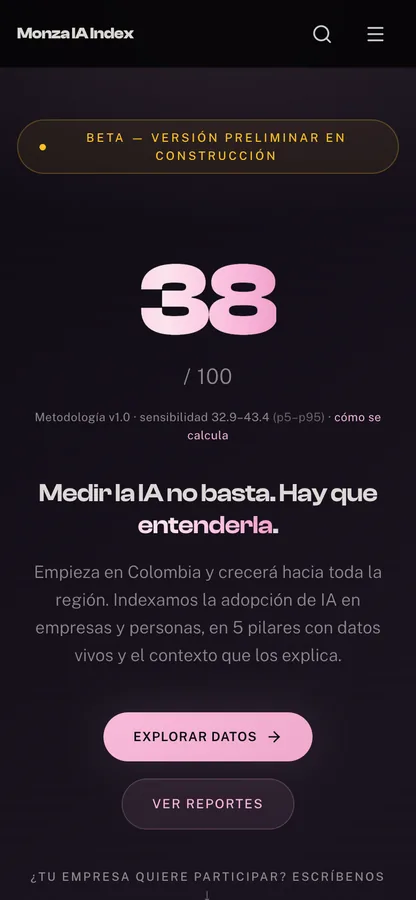
The score sums up artificial intelligence adoption across five pillars with explicit weights: companies, talent, ecosystem, consumers and regulation. Weights, anchors and sources are published.
What it solvesA figure you can quote and check, not an opinion.
02 · Data from public sources
Jobs, searches and open data, read by the system.
The system reads job boards, Google Trends, government open data and figures from the World Bank and the IMF, and sorts them by pillar.
What it solvesNo one has to rebuild the database by hand every time it updates.
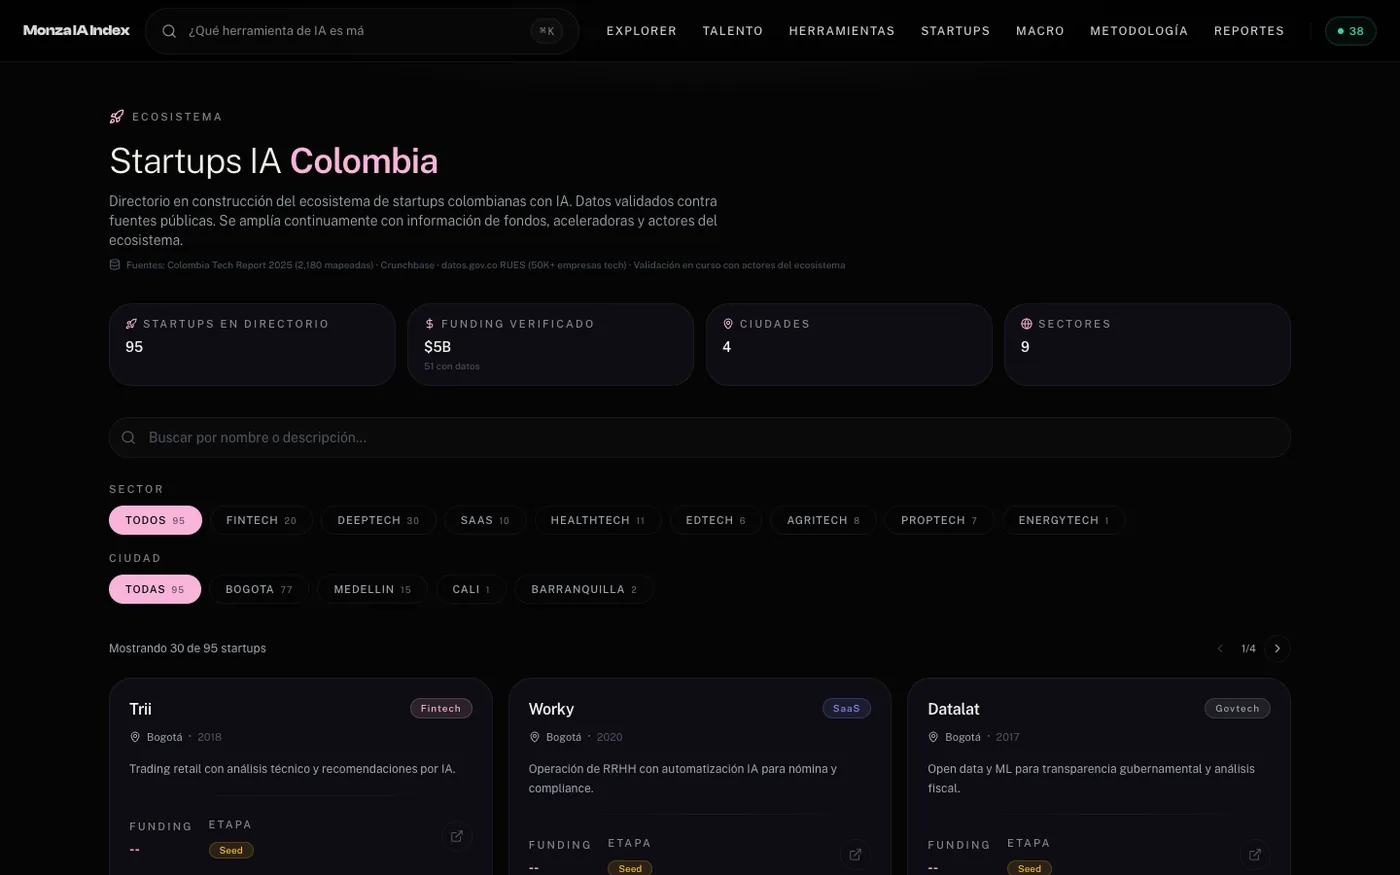
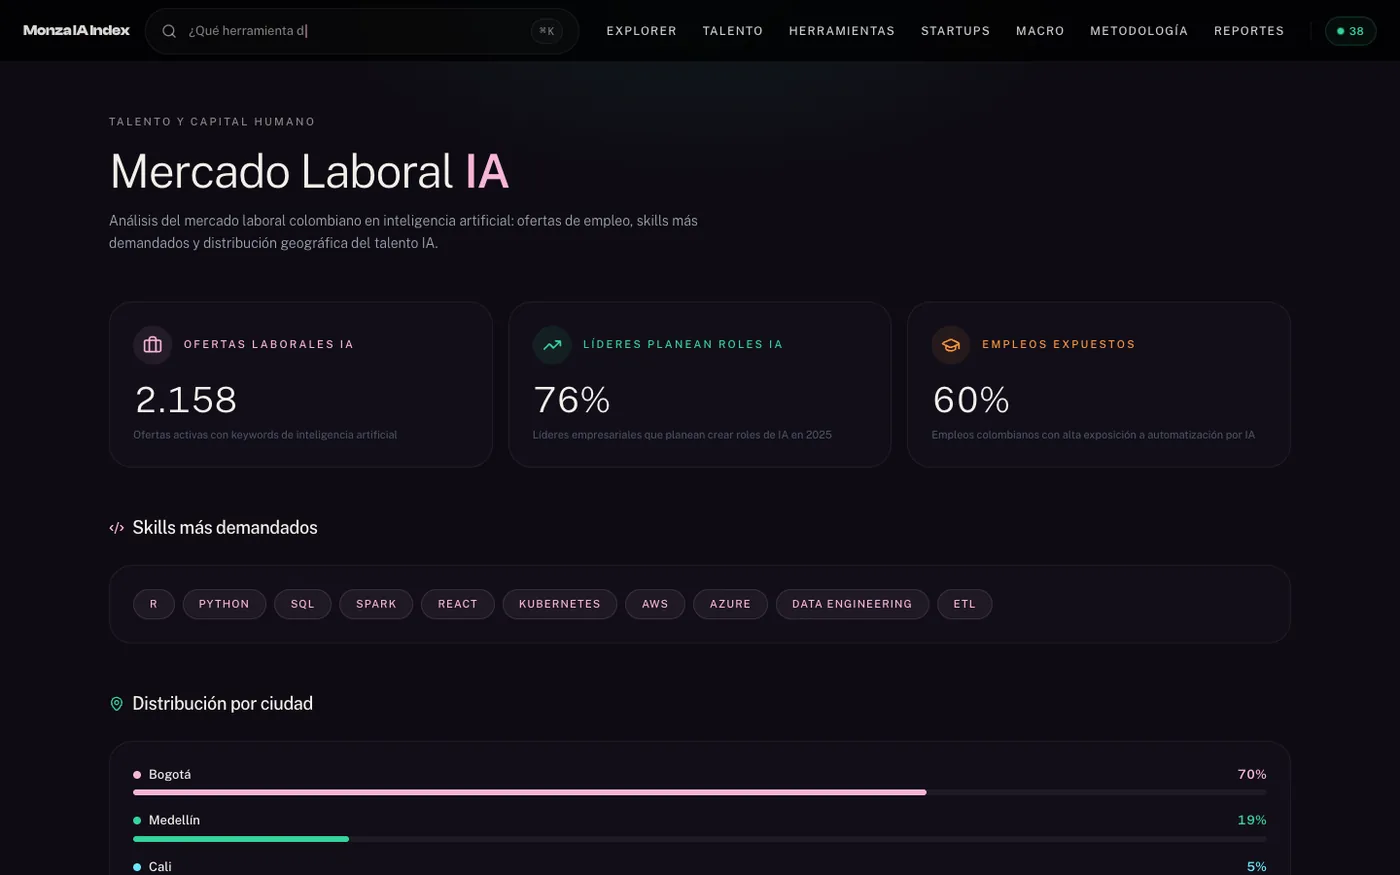
03 · The explorer
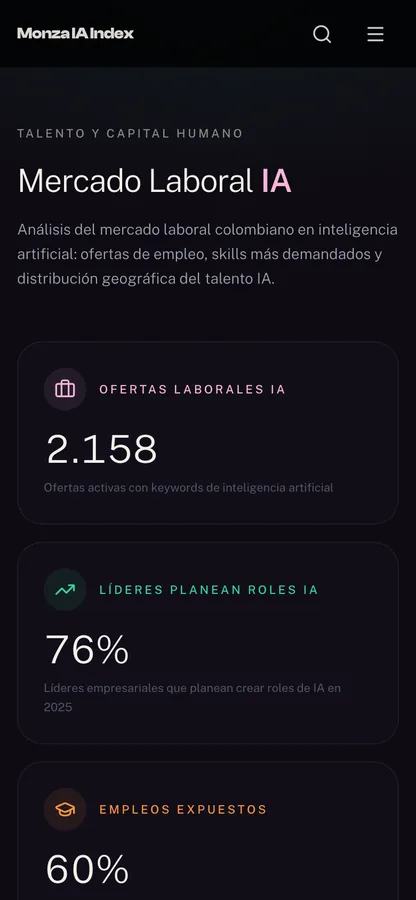
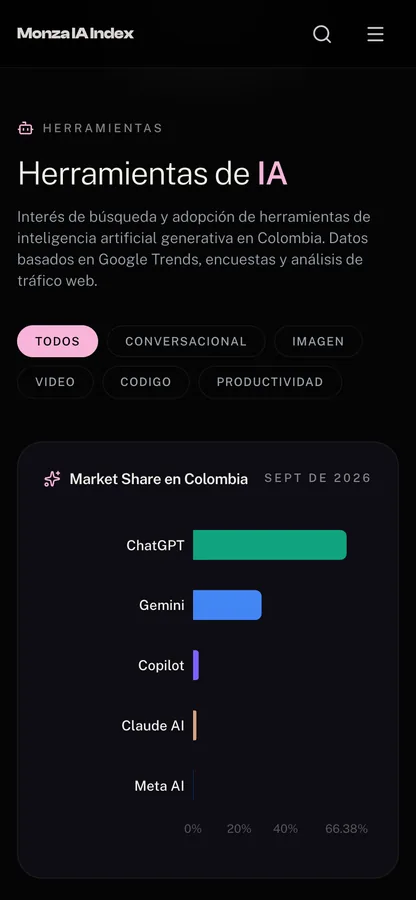
Talent, tools, startups and context, each on its own page.
Every dimension can be explored: which skills are in demand, which tools are used, which AI startups exist and in what economic context.
What it solvesA company or an investor finds the figure they need without asking for it.
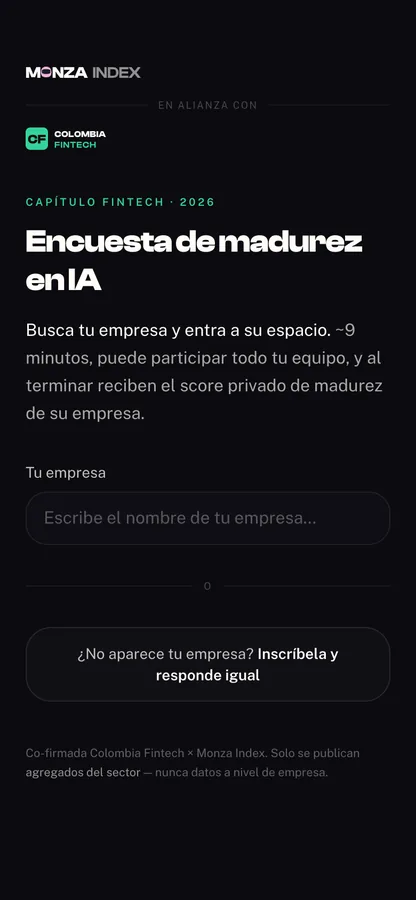
04 · The AI-led survey
A company survey run by an artificial intelligence interviewer.
In partnership with Colombia Fintech, each company enters its own space, answers in about nine minutes with its team and gets its private maturity score. Only sector-level aggregates are published.
What it solvesFirst-hand data that no public portal has.
05 · Partner spaces
A private space for each partner, with an assistant that answers questions about the data.
Partner companies have their own space inside the index, with their data and an artificial intelligence assistant that answers questions about it.
What it solvesThe data reaches the decision maker, in their own words.
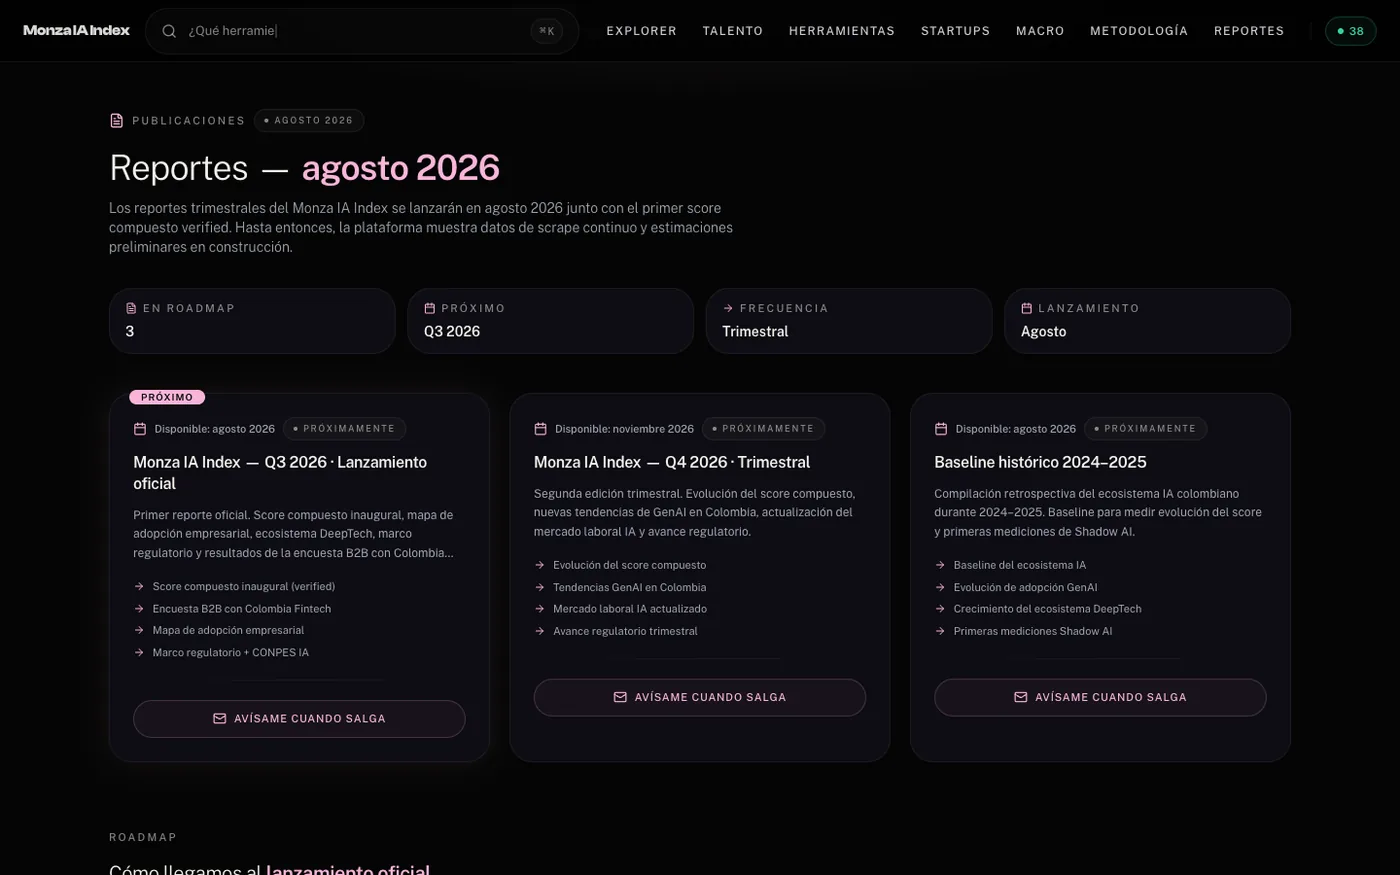
06 · Reports
Quarterly reports to decide with data.
Each report brings the score, the map of business adoption and the results of the survey of one sector.
What it solvesA regular check-in on the state of AI in the country.
Public data, connected, with artificial intelligence inside.
The sources feed a single database; the score, the explorer and the reports come out of it. In pink, where artificial intelligence works. Tap any of them.
Monza Index0 to 100 score
ToolArtificial intelligence
The score, the data and the survey.
Swipe
An index anyone can check.
Score that sums up AI adoption in Colombia.
Pillars with explicit weights and a published formula.
Public sources that the system reads and sorts.
Keep looking.

Let's talk
Can you picture your data working like this?
Tell me what you want to measure and I'll tell you what I'd connect first.